Texas public school COVID data
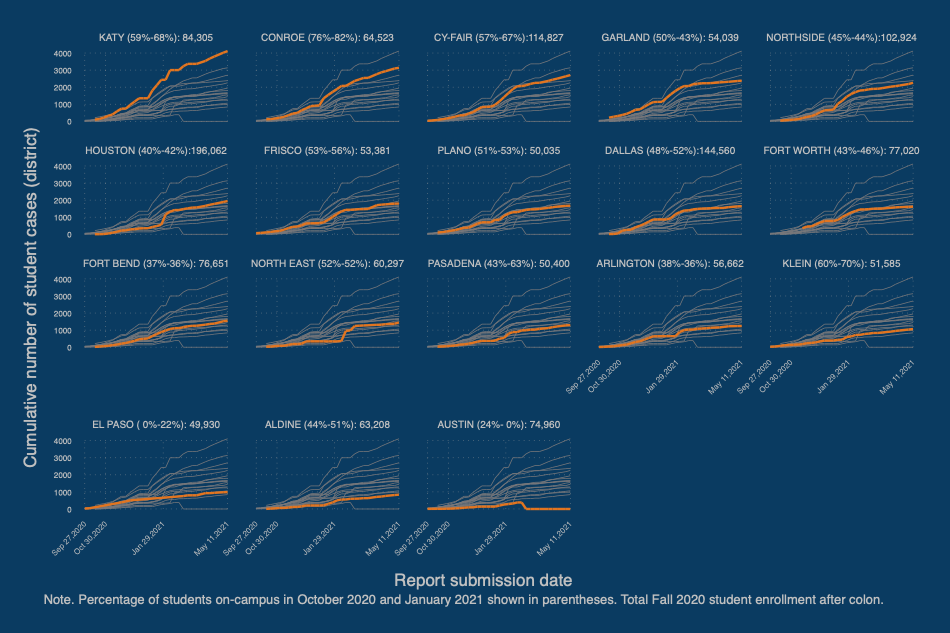
Since September 2020, TEA has required districts to report information about COVID-cases among students and staff, as well as the number of students who are attending in-person. The case data reporting interval is weekly, while in-person attendance rates have been reported effective the last week of October and January. An additional in-person reporting period will be published later in Spring 2021. These data are part of a larger collection effort to obtain information on students' instructional modality during the 2020/21 school year.
Public reporting of these data is limited, so I created an interactive Leaflet map using the Python Folium library, which is embedded below. I linked a number of additional data sources to the COVID data files, including:
- Annual Texas Academic Performance Reporting (TAPR) data to obtain demographic, enrollment, and academic performance data;
- District geographic boundary GeoJson to create the maps;
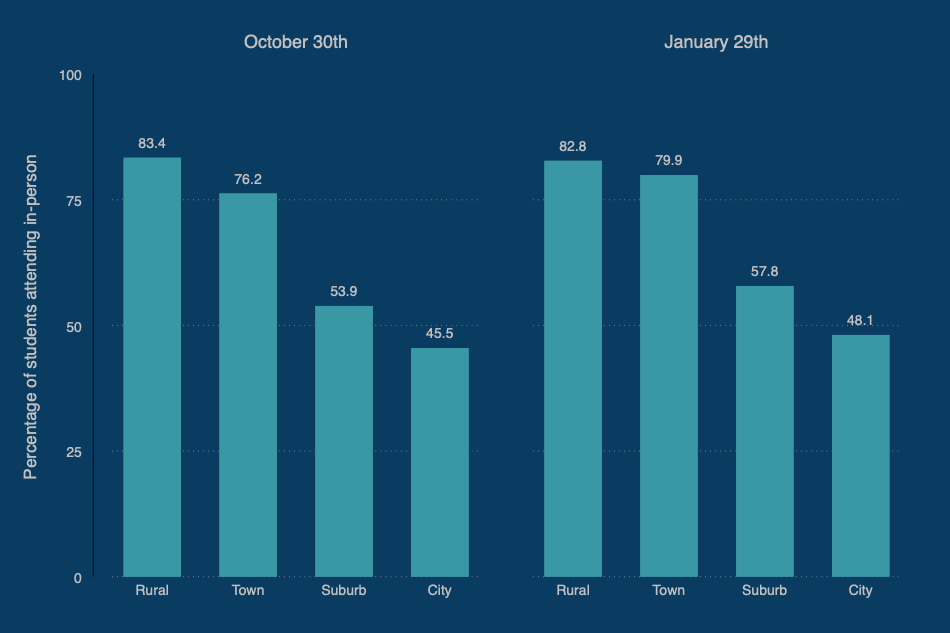
- Common Core of Data (CCD) for urbanicity;
- County-level election returns from the 2020 election.
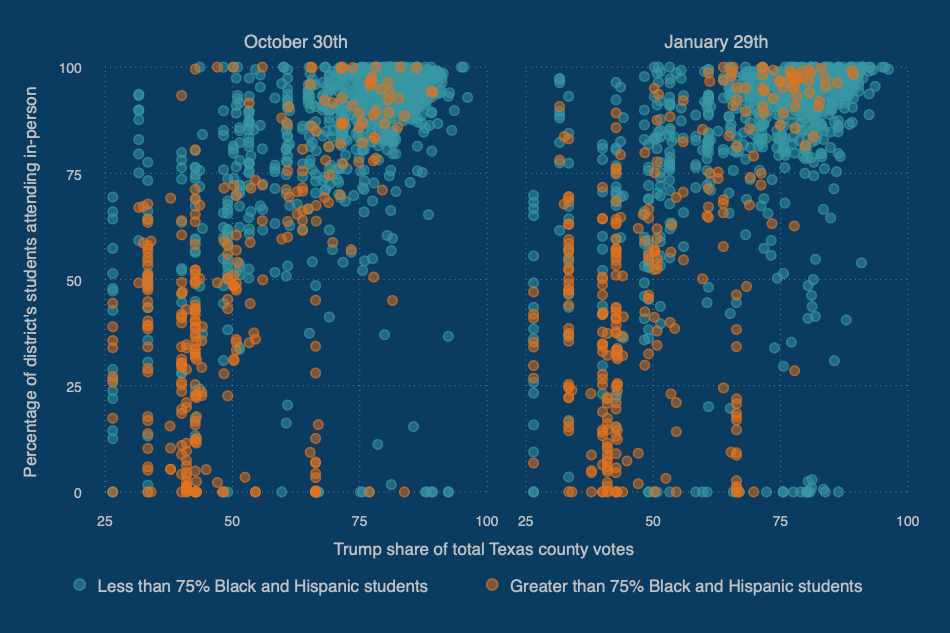
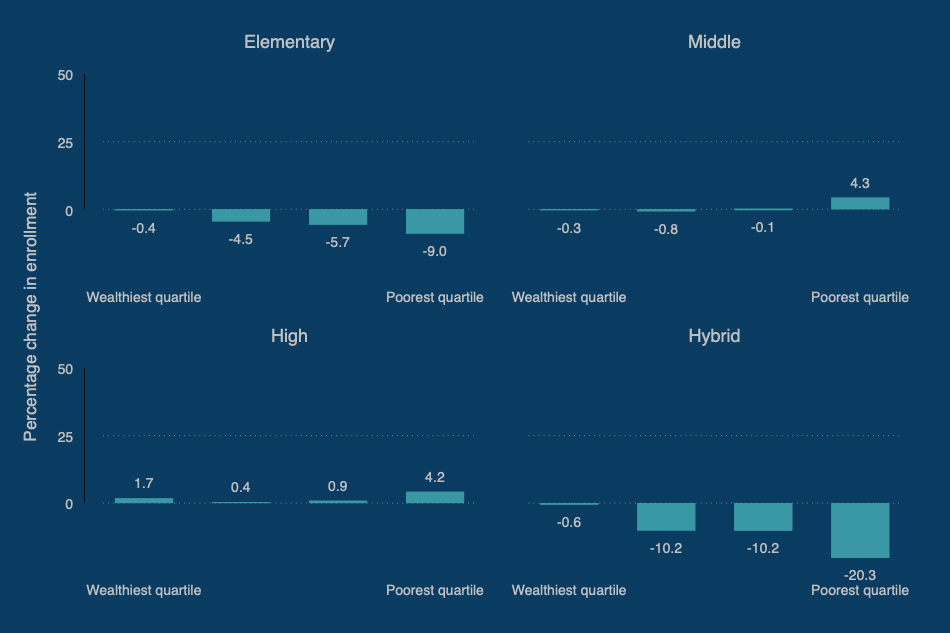
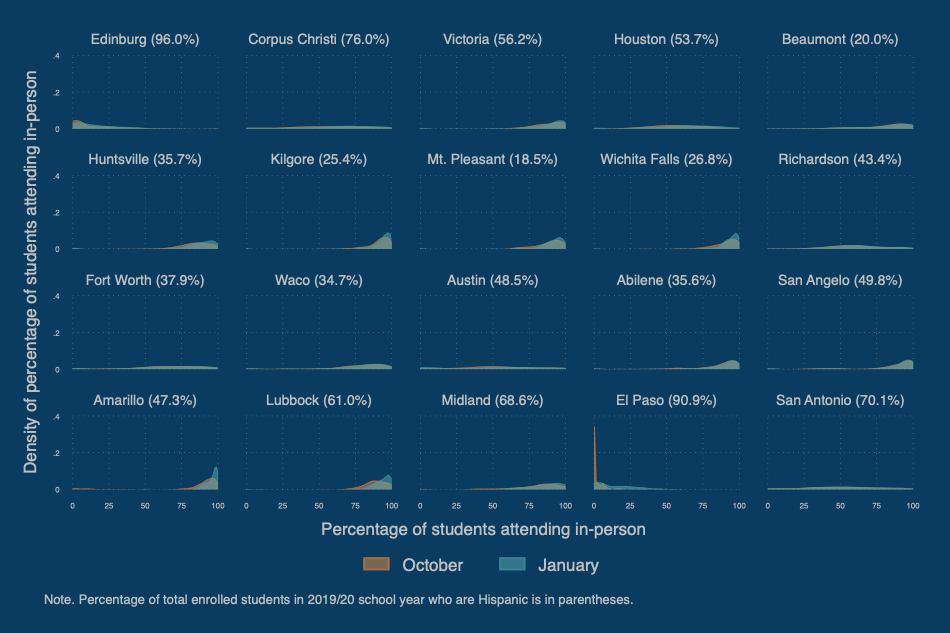
The embedded map is interactive: hover over a district boundary for enrollment and other information, including the cumulative case rate, locale, and total student enrollment. Or, you can search for a specific district in the search tool in the upper-left corner. Data and a draft-y Jupyter notebook are stored in a GitHub repo. I’ve also posted some findings from the data below the map.
 |
 |
 |
 |
